What Is a Monitor? (And Why Logs Aren't Enough)
July 27, 2026
·4 min read
·
If a tree falls in a forest and no one is around to hear it, does it make a sound? More importantly: if your microservice crashes at 3:00 AM on a Sunday and no user tries to check out for three hours, is your system broken?
To your database, everything is fine. To your logs, a few error traces were written hours ago. But to your business, you are silently out of service.
This is the gap a monitor exists to fill.
Whether you are running simple scheduled cron jobs or managing hundreds of Kubernetes pods, understanding what a monitor is—and how to construct meaningful health checks—is the foundation of modern observability.
So, What Is a Monitor?
At its core, a monitor is an automated mechanism that regularly tests a system's state against a expected baseline and triggers an action (like an alert) when the actual state strays from that baseline.
Unlike logging (which records events after they happen) or tracing (which follows a single request through multiple services), monitoring is state-oriented and time-bound. It asks a continuous, simple question: "Is this component operating within acceptable parameters right now?"
A monitor generally consists of three components:
The Probe (or Check): The mechanism that observes or pings the target (e.g., an HTTP GET request to
/healthz).The Logic (or Threshold): The conditions that define health (e.g., "HTTP status must be
200AND response time must be< 500ms").The Action (or Dispatcher): What happens when the condition fails (e.g., sending a PagerDuty alert, Slack message, or triggering an automated rollback).
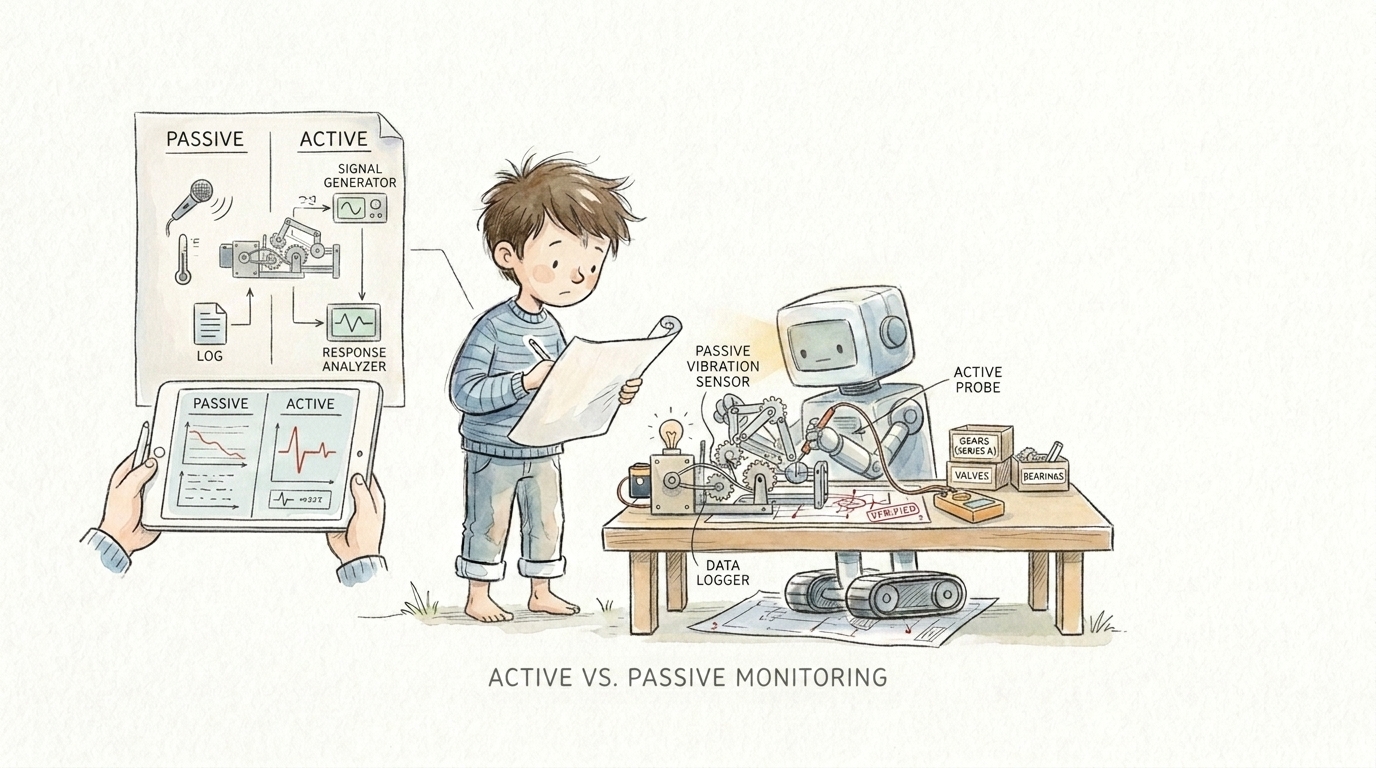
The Two Core Types: Active vs. Passive Monitoring
Not all monitoring works the same way. In modern cloud-native architectures, monitoring is split into two main paradigms:
1. Active (Synthetic) Monitoring
Active monitoring simulates real-world interactions from the outside in. The monitoring platform proactively sends requests to your service at fixed intervals to verify functionality.
Example: Checking an API
/healthendpoint every 30 seconds.Best for: Uptime verification, HTTP response timing, and testing synthetic user flows.
Limitation: It only tests what you explicitly tell it to check.
2. Passive (Telemetry/Metrics) Monitoring
Passive monitoring listens inside the system. Instead of pinging an endpoint, your applications, background workers, or infrastructure stream metrics (CPU usage, memory footprint, job execution duration) to a collector.
Example: A background worker reporting its job completion time to a queue collector.
Best for: Resource utilization, detecting memory leaks, and tracking internal job queues.
Limitation: High volumes of telemetry can create noise if threshold alerts aren't carefully calibrated.
Monitoring Cron Jobs & Background Tasks: The "Dead Man's Snitch"
Standard HTTP uptime checks work great for web servers, but what about background jobs that only run once every 24 hours?
If a daily database backup cron job fails to run, an external ping will never detect it because there is no endpoint to ping.
This requires Heartbeat (or Inverted) Monitoring:
Your scheduled job executes.
Upon successful completion, the job sends an HTTP request (a "ping" or "heartbeat") to the monitor.
If the monitor doesn't hear from your job within the expected window (e.g., 24 hours + 5-minute grace period), it marks the job as FAILED and alerts your team.
3 Rules for Writing Effective Monitors
Bad monitoring is worse than no monitoring—it leads to alert fatigue, where developers ignore notifications because 90% of them are false alarms. Here are three principles to follow:
Monitor Outcomes, Not Just Infrastructure: A server with 95% CPU usage isn't necessarily broken if it's successfully processing requests under threshold. Monitor user impact (latency, error rates) before server metrics.
Make Alerts Actionable: Every alert generated by a monitor should have a clear next step. If an alert triggers and the response is "ignore it until morning," the threshold is set incorrectly.
Account for Flappiness: Transports drop packets. Don't trigger a Sev-1 incident on a single missed check. Require 2 or 3 consecutive failures (or a retried failure) before firing an alert.
Share this post
Related Posts
Keep reading from this category

Demystifying TCP Monitoring: How Crystade Keeps Your Digital World Connected
Ever wondered how streaming services, online stores, and workplace apps stay fast and responsive? It all comes down to TCP connection health. Learn what TCP monitoring is in plain English and how Crystade makes network visibility effortless for everyone.


Say Goodbye to Broken Schedules: Introducing Crystade Cron Jobs
Stop wrestling with crontabs, fragile in-app schedulers, and blind execution failures.